|
| Home | News | Members | Research | Data | Models | Guides | Gallery | Misc. | Contact |
|
| Home | News | Members | Research | Data | Models | Guides | Gallery | Misc. | Contact |
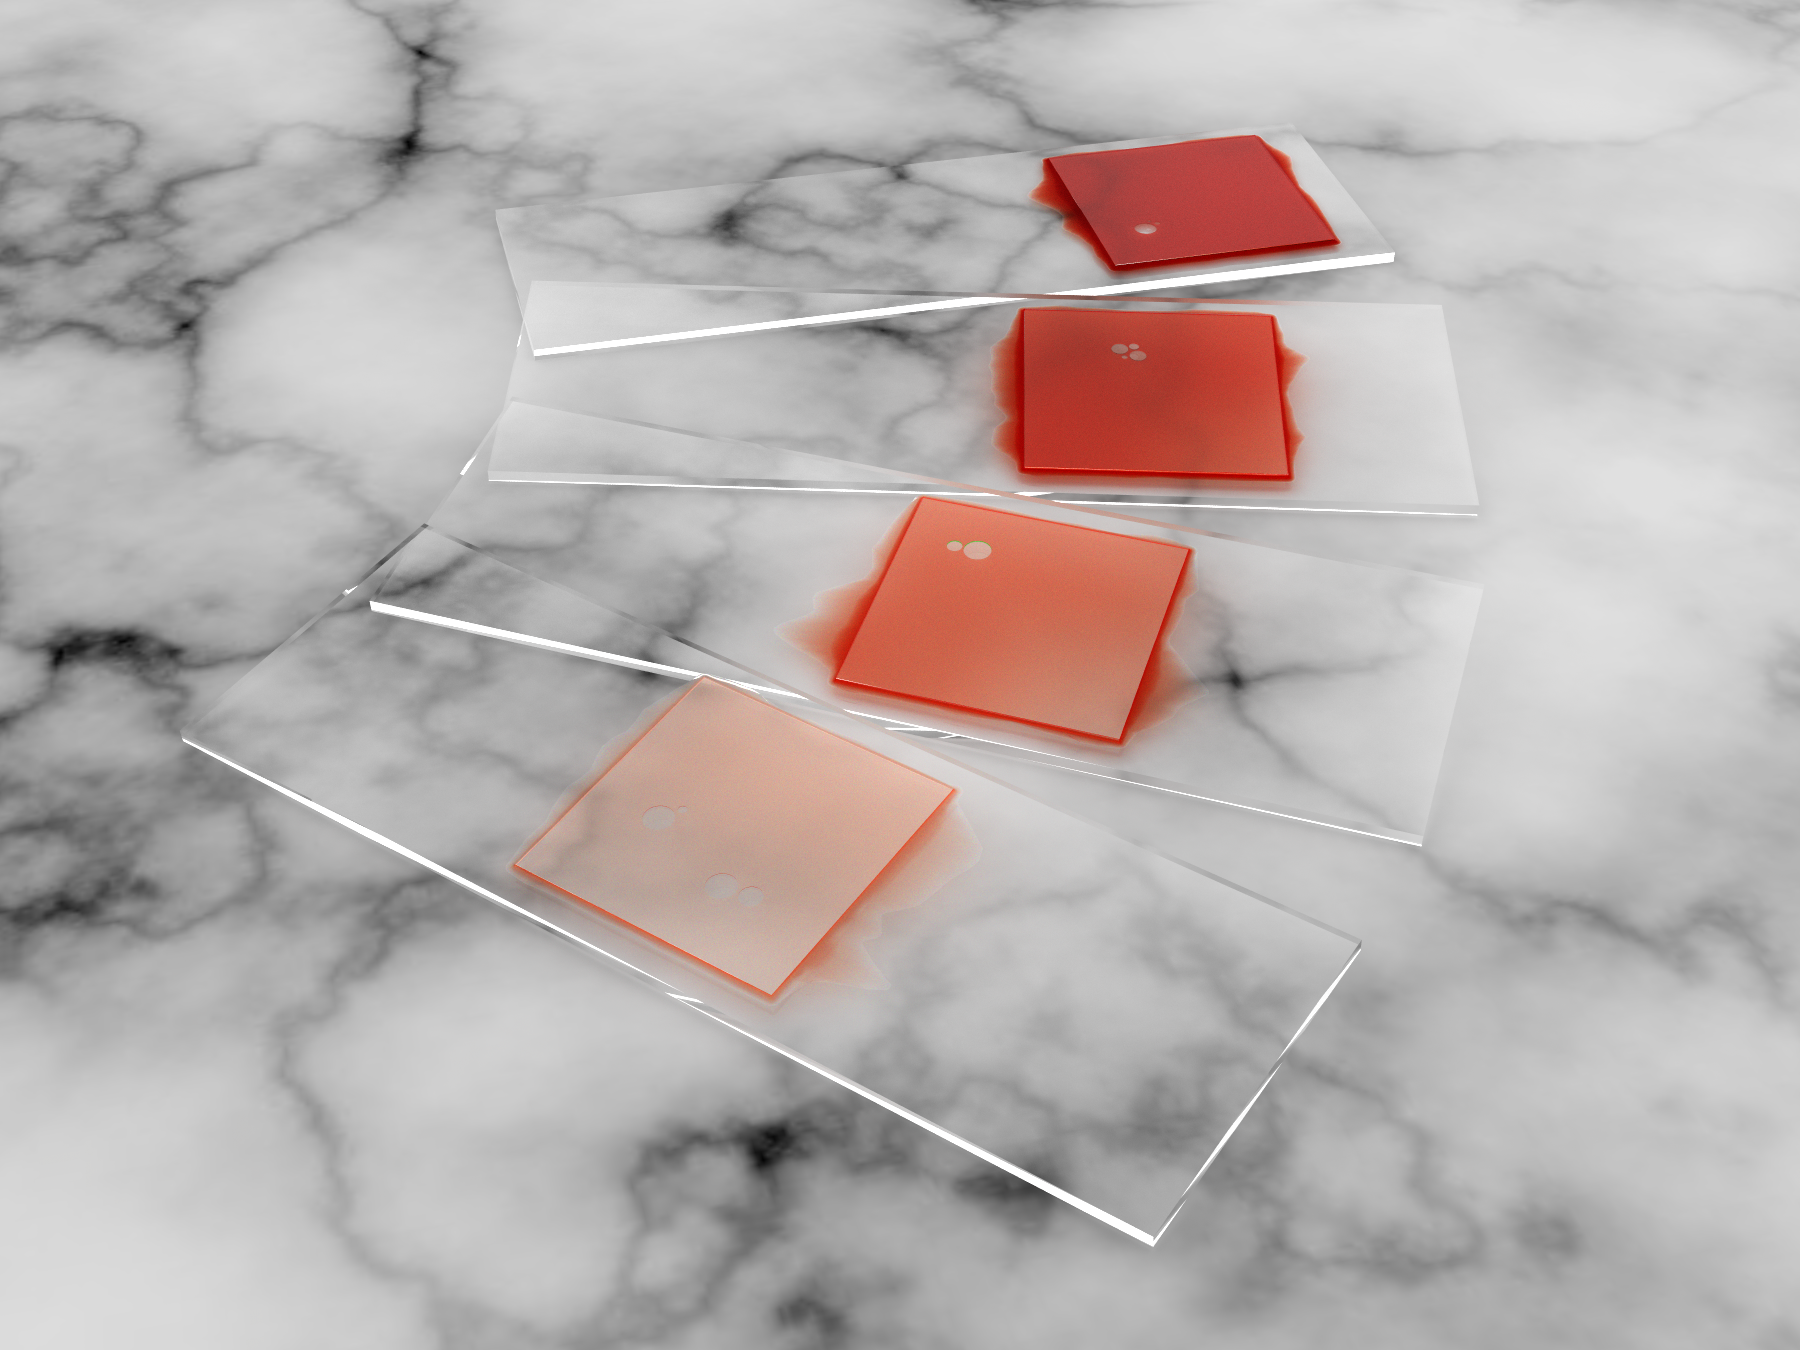
Simulation of Hematocrit VariationsRendered image of four microscope slides of blood with varying hematocrit
levels.
|